

SPC Day 1 outlook
- General Thunderstorms Risk
SPC’s Day 1 categorical outlook, valid to , issued . SPC’s categories, as drawn. Data: NOAA/SPC.
Storm Mode / Tracked area
CURRENT CONTEXT · 0 warnings total · 0 tornado warnings · 7 alerts including watches and advisories
Current alert feed · checked
Places saved on this device appear here with scripting enabled.
NWS’s polygons as issued, or the zones a zone-issued alert names; SPC’s watches by their counties. Checked . Data: NOAA/NWS, NOAA/SPC.
Interactive imagery loads separately. Missing radar does not remove warnings or imply clear weather.
Alert outlines: NOAA/NWS; cell points/observed segments: IEM/NEXRAD. A warning polygon is not a tornado footprint.
Total lightning, including in-cloud activity. Not ground-strike locations or a safe-to-go-outside signal.
Cached lightning observations have not loaded. An empty map is not zero lightning.
Source-rendered snow depth and snow water equivalent for the lower 48. History changes this snow picture only; warnings and radar keep their own clocks.
Stored snow depth · footprint valid 2026-10-18 06:00:00 UTC, picture retrieved 2026-10-18 12:23:04.796 UTC.
No NOHRSC picture displayed on the interactive map.
 0 - 0.39 in
 0.39 - 2.0 in
 2.0 - 3.9 in
 3.9 - 9.8 in
 9.8 - 20 in
 20 - 39 in
 39 - 59 in
 59 - 98 in
 98 - 197 in
 197 - 295 in
 295 - 394 in
 394 - 787 in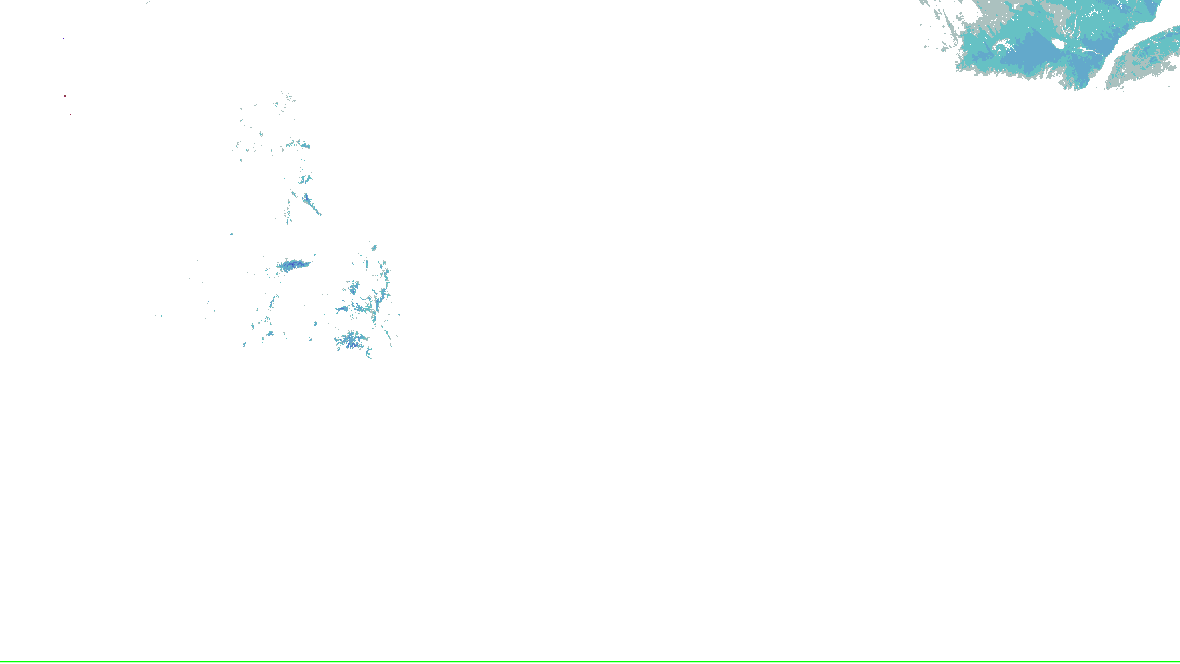
NOHRSC footprint times are metadata; pixel analysis time is not independently verified. Snow-depth pixels have previously differed from the footprint time. This is modeled/assimilated snow analysis, not a measurement at a place. Unshaded and no-data areas do not establish zero snow.
Replay uses retained source bytes. Recording begins with activation; missing history is not clear weather.
Live sources keep independent clocks.
Rolling target: 24 hours; cells: six hours. Radar: NOAA MRMS national overview, 8-minute tolerance. Satellite: original GOES GeoColor day/night picture, hourly sampling, 75-minute tolerance. No interpolation or latest-image fallback. Warning and source checks retain their own clocks. “Recorded by” is collector acquisition evidence, not exact browser publication history.
Current GLM density, velocity and specialist layers are hidden during replay. Snow uses retained footprint metadata with unverified pixel time. Forecast uses one pinned issuance/run and exact valid time.
No observed replay frame displayed.
Open the complete replay reader (works without scripting or WebGL)Collector checked ; feed generated . Zero cells does not establish coverage or clear weather. Observations from different radars are not merged.
Surface source current; observed water-level source current. Each reading keeps its own time. Map markers show at most 500 stations and 500 gauges; the complete source directory is paginated.
Circle: surface station; square: water-level gauge. Filled: current reading and source; hollow: stale, unconfirmed or missing observation. Marker color is not a hazard category. Enable “Stations and gauges” in Layers to inspect them on the map.
Showing 77 of 77 listed sources. All surface stations and retained trends · All supported gauges and forecasts
unavailable · No observation in the latest cached source list. Retained readings below are historical; an absent gauge may have fallen below action stage or stopped reporting.
Tide gauge (coastal water level) · Chesapeake Bay Bridge Tunnel (IN MLLW) · Chesapeake Bay · -76.08325, 37.03291. Units ft; datum not supplied.
Source checked 2026-10-18 14:35:04.800Z · current.
Stage in this gauge’s units, not a regional flood depth. Tide/lake gauges remain water levels; datum is not supplied by this feed. Historical observations and the latest forecast keep separate times.
Retained observations: 5; target 24 hours, at most 96 reports per station. Recording began 2026-10-17 06:15:05.234Z; oldest available reading 2026-10-18 08:36:00 UTC.
Highest listed forecast: 5.3 ft at 2026-10-21 20:00:00 UTC; issued 2026-10-18 09:17:00 UTC. Minor flooding.
Forecasts are issued routinely year-round.
Gauge thresholds: action 4.5 ft; minor 5 ft; moderate 5.5 ft; major 6 ft.
| Forecast valid time (UTC) | Forecast Tide Height |
|---|---|
| 2026-10-18 09:00:00 UTC | 3.1 ft |
| 2026-10-18 10:00:00 UTC | 2.9 ft |
| 2026-10-18 11:00:00 UTC | 2.7 ft |
| 2026-10-18 12:00:00 UTC | 2.6 ft |
| 2026-10-18 13:00:00 UTC | 2.8 ft |
| 2026-10-18 14:00:00 UTC | 3 ft |
| 2026-10-18 15:00:00 UTC | 3.3 ft |
| 2026-10-18 16:00:00 UTC | 3.8 ft |
| 2026-10-18 17:00:00 UTC | 4.1 ft |
| 2026-10-18 18:00:00 UTC | 4.3 ft |
| 2026-10-18 19:00:00 UTC | 4.2 ft |
| 2026-10-18 20:00:00 UTC | 4.1 ft |
| 2026-10-18 21:00:00 UTC | 3.8 ft |
| 2026-10-18 22:00:00 UTC | 3.4 ft |
| 2026-10-18 23:00:00 UTC | 2.9 ft |
| 2026-10-19 00:00:00 UTC | 2.7 ft |
| 2026-10-19 01:00:00 UTC | 2.6 ft |
| 2026-10-19 02:00:00 UTC | 2.7 ft |
| 2026-10-19 03:00:00 UTC | 2.9 ft |
| 2026-10-19 04:00:00 UTC | 3.3 ft |
| 2026-10-19 05:00:00 UTC | 3.6 ft |
| 2026-10-19 06:00:00 UTC | 4 ft |
| 2026-10-19 07:00:00 UTC | 4 ft |
| 2026-10-19 08:00:00 UTC | 3.9 ft |
| 2026-10-19 09:00:00 UTC | 3.7 ft |
| 2026-10-19 10:00:00 UTC | 3.5 ft |
| 2026-10-19 11:00:00 UTC | 3.1 ft |
| 2026-10-19 12:00:00 UTC | 2.9 ft |
| 2026-10-19 13:00:00 UTC | 2.9 ft |
| 2026-10-19 14:00:00 UTC | 3 ft |
| 2026-10-19 15:00:00 UTC | 3.3 ft |
| 2026-10-19 16:00:00 UTC | 3.6 ft |
| 2026-10-19 17:00:00 UTC | 4.1 ft |
| 2026-10-19 18:00:00 UTC | 4.4 ft |
| 2026-10-19 19:00:00 UTC | 4.6 ft |
| 2026-10-19 20:00:00 UTC | 4.8 ft |
| 2026-10-19 21:00:00 UTC | 4.6 ft |
| 2026-10-19 22:00:00 UTC | 4.3 ft |
| 2026-10-19 23:00:00 UTC | 3.9 ft |
| 2026-10-20 00:00:00 UTC | 3.5 ft |
| 2026-10-20 01:00:00 UTC | 3.2 ft |
| 2026-10-20 02:00:00 UTC | 3.1 ft |
| 2026-10-20 03:00:00 UTC | 3.2 ft |
| 2026-10-20 04:00:00 UTC | 3.5 ft |
| 2026-10-20 05:00:00 UTC | 3.9 ft |
| 2026-10-20 06:00:00 UTC | 4.3 ft |
| 2026-10-20 07:00:00 UTC | 4.6 ft |
| 2026-10-20 08:00:00 UTC | 4.8 ft |
| 2026-10-20 09:00:00 UTC | 4.8 ft |
| 2026-10-20 10:00:00 UTC | 4.6 ft |
| 2026-10-20 11:00:00 UTC | 4.2 ft |
| 2026-10-20 12:00:00 UTC | 3.8 ft |
| 2026-10-20 13:00:00 UTC | 3.5 ft |
| 2026-10-20 14:00:00 UTC | 3.4 ft |
| 2026-10-20 15:00:00 UTC | 3.5 ft |
| 2026-10-20 16:00:00 UTC | 3.7 ft |
| 2026-10-20 17:00:00 UTC | 4 ft |
| 2026-10-20 18:00:00 UTC | 4.5 ft |
| 2026-10-20 19:00:00 UTC | 4.8 ft |
| 2026-10-20 20:00:00 UTC | 5.1 ft |
| 2026-10-20 21:00:00 UTC | 5.1 ft |
| 2026-10-20 22:00:00 UTC | 4.9 ft |
| 2026-10-20 23:00:00 UTC | 4.6 ft |
| 2026-10-21 00:00:00 UTC | 4.1 ft |
| 2026-10-21 01:00:00 UTC | 3.6 ft |
| 2026-10-21 02:00:00 UTC | 3.3 ft |
| 2026-10-21 03:00:00 UTC | 3.3 ft |
| 2026-10-21 04:00:00 UTC | 3.4 ft |
| 2026-10-21 05:00:00 UTC | 3.7 ft |
| 2026-10-21 06:00:00 UTC | 4.2 ft |
| 2026-10-21 07:00:00 UTC | 4.6 ft |
| 2026-10-21 08:00:00 UTC | 5 ft |
| 2026-10-21 09:00:00 UTC | 5.2 ft |
| 2026-10-21 10:00:00 UTC | 5.1 ft |
| 2026-10-21 11:00:00 UTC | 4.9 ft |
| 2026-10-21 12:00:00 UTC | 4.4 ft |
| 2026-10-21 13:00:00 UTC | 4 ft |
| 2026-10-21 14:00:00 UTC | 3.6 ft |
| 2026-10-21 15:00:00 UTC | 3.5 ft |
| 2026-10-21 16:00:00 UTC | 3.7 ft |
| 2026-10-21 17:00:00 UTC | 4 ft |
| 2026-10-21 18:00:00 UTC | 4.3 ft |
| 2026-10-21 19:00:00 UTC | 4.8 ft |
| 2026-10-21 20:00:00 UTC | 5.3 ft |
| Observed (UTC) | Stage / units | Source category / water |
|---|---|---|
| 2026-10-18 08:36:00 UTC | 6.17 ft | Major flooding · Tide gauge (coastal water level) |
| 2026-10-18 08:54:00 UTC | 6.08 ft | Major flooding · Tide gauge (coastal water level) |
| 2026-10-18 09:24:00 UTC | 6.14 ft | Major flooding · Tide gauge (coastal water level) |
| 2026-10-18 11:36:00 UTC | 5.13 ft | Minor flooding · Tide gauge (coastal water level) |
| 2026-10-18 11:54:00 UTC | 4.97 ft | Action stage · Tide gauge (coastal water level) |
Each report keeps its observation time, first capture of this version, and the SHA-256 of the source bulk body. Corrections at the same observation time replace that point and are marked; unrelated bulk-file changes do not freshen a report.
d4e4cc77d19cc3ff72d6286cb8f725b077587b20c7ce618af7e66a4252b5b6ce.6561b759fba2156bde0b43d6e94db6b89cc40f0829ee1201a9f1e304c165bbb8.e475568e8d4b015904ec594136858852549ad52eb8eea66b1014deb8bc172528.cbd1e58236ca3fb49bf5a7ea0fc0147357cc40b9a2beb0d15aa361ae7c4b454e.abf8ad17518780f707f5418aa0450a9f2058932e972516266c6ee3aa49432053.Only observed gauge records enter this history. Forecast maxima and forecast hydrograph points never become observations. A missing datum or unsupported flow value remains unknown.
Observation source page · Cached readings as JSON · Official source
Source-message history is not recorded imagery replay. Recorded radar/satellite imagery is not available in this view.
Checks every minute; each layer keeps its own time.
Water levels are relative to the named datum, not flood depth above ground. Observations keep their own report times.
Observed water level is relative to the named vertical datum, not flood depth above ground. Observed minus predicted tide is a matched-time residual, not a universal storm-surge or inundation forecast. Buoy wind is not a cyclone maximum; significant wave height is not coastal flood depth. Missing readings are not zero.
Only operator-configured public stations are collected. Coastal context includes stations inside the named monitoring area or within 100 nautical miles of a vertex of its published outline, so offshore buoys can be included; this is a proximity rule, not an impact footprint. Cyclone-only context is within 600 nautical miles of the selected advisory center. Shown center distances are not impact radii. Station-file history without a reported position is not assigned a historical location.
Source current · checked 2026-10-18 14:32:01.940Z. 0 configured stations in this view.
No configured station has been collected in this scope. This does not establish safe coastal conditions.
Source current · checked 2026-10-18 14:36:02.792Z. 0 configured stations in this view.
No configured station has been collected in this scope. This does not establish safe coastal conditions.
SPC’s Day 1 categorical outlook, valid to , issued . SPC’s categories, as drawn. Data: NOAA/SPC.
No tornado or severe thunderstorm watch in force in this area.
SPC’s watches, by number, matched by the counties they list. Data: NOAA/SPC.
No mesoscale discussion reaches this area.
SPC’s mesoscale discussions whose outline reaches the area. Data: NOAA/SPC.
SPC’s hourly mesoanalysis, observed soundings and model guidance for the area, on the Analysis tab with its own clocks.
Drawn by the Analysis tab’s own renderer. Data: NOAA/SPC, NOAA/NCEP.
WPC’s excessive rainfall outlook, to , issued : a chance of flash flooding, in four categories. Data: NOAA/WPC.
0 major · 6 moderate · 18 minor · 4 at action stage
NWS’s gauges at flood stage or above in the area, worst first, each with its forecast hydrograph on Rain & rivers. Data: NOAA/NWPS.
WPC’s rain forecast and MRMS’s radar estimate of the rain that fell, on the Briefing’s map for the area.
Data: NOAA/WPC, NOAA/NSSL MRMS.
WPC: “WSSI does not depict official warnings and should always be used in context with official NWS forecasts and warnings.”
Each day and cause on the Winter tab, with its own issue time
WPC’s WSSI, overall impact, Days 1–3, valid to , issued . WPC issues each day and cause on its own clock. Not a warning, and not a chance. Data: NOAA/NWS/WPC.
WPC: “WSSI does not depict official warnings and should always be used in context with official NWS forecasts and warnings.”
Each level and day on the Winter tab
WPC’s WSSI-P: no chance drawn for Day 1. Data: NOAA/NWS/WPC.
WPC gives no chance of 4 inches of snow or more in this area over the next three days, so Day 1’s 4 inches is shown.
Every day and amount on the Winter tab
WPC’s Probabilistic Winter Precipitation Forecast, to , issued . Outlines, as WPC draws them. Data: NOAA/NWS/WPC.
No winter or cold watch, warning or advisory in force in this area.
NWS’s winter and cold alerts in force in the area, by event as issued, each counted once, with the offices that issued them and the latest end. Data: NOAA/NWS.
NOHRSC snow depth and snow water equivalent use the source’s original pictures and legends, with qualified footprint times. Open the cached source page for availability and retained history. This wall has no snow picture to rotate; missing imagery does not mean no snow.
Data: NOAA/NWS/NOHRSC. Snow analysis, not a measurement at a place.
Issued , for to . WPC’s words, as written. Data: NOAA/NWS/WPC.
NHC’s and JTWC’s storms, their official graphics and the watches and warnings for them. Storm Mode’s own tropical panels arrive with its tropical events.
Data: NOAA/NHC, JTWC.
NOAA’s radar for the area, loaded by your browser as on the Radar page.
Live tiles; the radar keeps no last-good copy.
The products’ own words and times, and what is no longer in force since the last read. Never written by AI.
An area you chose, not a storm’s footprint: everything here is in force in this area, never “from this storm”.
Most urgent first, by the Briefing’s ranking. Checked .
NWS warnings and SPC watches checked
NWS watches and advisories checked
SPC mesoscale discussions checked
SPC Day 1 outlook checked
WPC excessive rainfall checked
NWPS river gauges checked
WPC WSSI checked
WPC WSSI-P checked
WPC snow and ice chances checked
WPC heavy snow and icing discussion checked
Radar live tiles, no last-good copy
Not an official warning service. Warnings and watches are the National Weather Service’s, outlooks and reports the Storm Prediction Center’s and the Weather Prediction Center’s (Data: NOAA/NWS, NOAA/SPC, NOAA/WPC). When a warning is issued for you, act on it, and use weather.gov or a NOAA Weather Radio for where you are.