

Radar
NOAA’s radar for the area, loaded by your browser as on the Radar page.
Live tiles; the radar keeps no last-good copy.
Storm Mode / Tracked area
4 warnings total · 0 tornado warnings · 5 alerts including watches and advisories
Current alert feed · checked
Places saved on this device appear here with scripting enabled.
NWS’s polygons as issued, or the zones a zone-issued alert names; SPC’s watches by their counties. Checked . Data: NOAA/NWS, NOAA/SPC.
Interactive imagery loads separately. Missing radar does not remove warnings or imply clear weather.
Alert outlines: NOAA/NWS; cell points/observed segments: IEM/NEXRAD. A warning polygon is not a tornado footprint.
Total lightning, including in-cloud activity. Not ground-strike locations or a safe-to-go-outside signal.
Cached lightning observations have not loaded. An empty map is not zero lightning.
Source-rendered snow depth and snow water equivalent for the lower 48. History changes this snow picture only; warnings and radar keep their own clocks.
Stored snow depth · footprint valid 2026-10-17 00:00:00 UTC, picture retrieved 2026-10-17 06:08:57.387 UTC.
No NOHRSC picture displayed on the interactive map.
 0 - 0.39 in
 0.39 - 2.0 in
 2.0 - 3.9 in
 3.9 - 9.8 in
 9.8 - 20 in
 20 - 39 in
 39 - 59 in
 59 - 98 in
 98 - 197 in
 197 - 295 in
 295 - 394 in
 394 - 787 in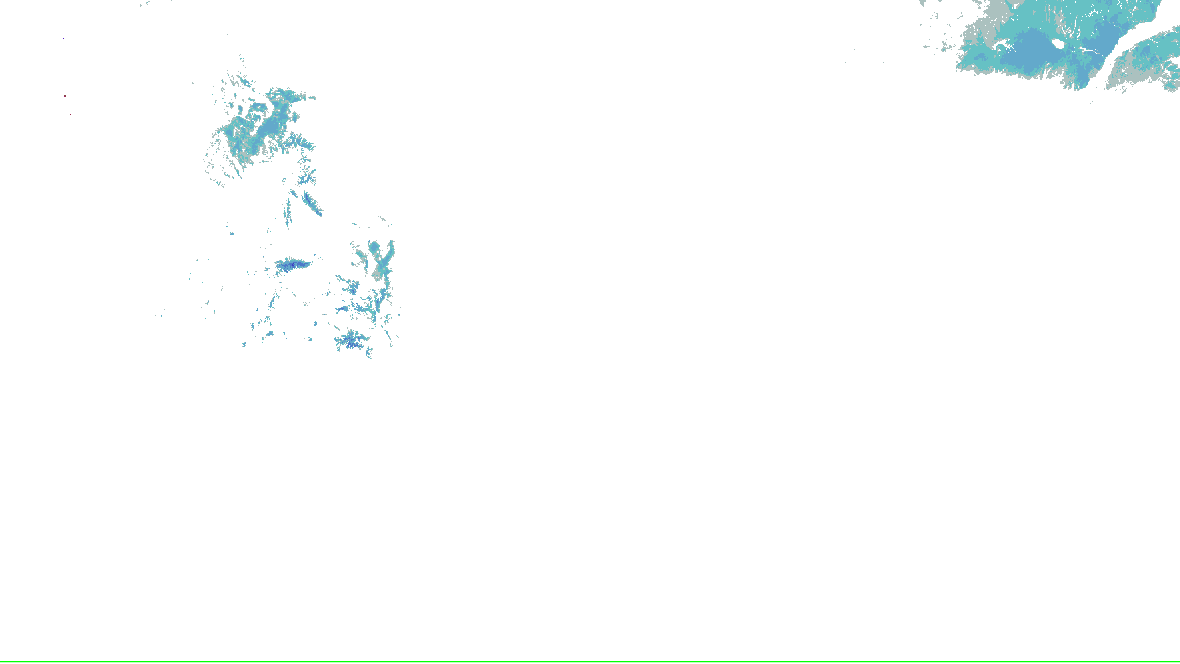
NOHRSC footprint times are metadata; pixel analysis time is not independently verified. Snow-depth pixels have previously differed from the footprint time. This is modeled/assimilated snow analysis, not a measurement at a place. Unshaded and no-data areas do not establish zero snow.
Collector checked not reported; feed generated not reported. Zero cells does not establish coverage or clear weather. Observations from different radars are not merged.
Surface source current; observed water-level source current. Each reading keeps its own time. Map markers show at most 500 stations and 500 gauges; the complete source directory is paginated.
Circle: surface station; square: water-level gauge. Filled: current reading and source; hollow: stale, unconfirmed or missing observation. Marker color is not a hazard category. Enable “Stations and gauges” in Layers to inspect them on the map.
Showing 25 of 25 listed sources. All surface stations and retained trends · All supported gauges and forecasts
unavailable · No observation in the latest cached source list. Retained readings below are historical; an absent gauge may have fallen below action stage or stopped reporting.
Tide gauge (coastal water level) · Straits Point (IN MLLW) · St. George Creek · -76.5, 38.138333. Units ft; datum not supplied.
Source checked 2026-10-17 07:05:03.334Z · current.
Stage in this gauge’s units, not a regional flood depth. Tide/lake gauges remain water levels; datum is not supplied by this feed. Historical observations and the latest forecast keep separate times.
Retained observations: 0; target 24 hours, at most 96 reports per station. Recording began 2026-10-17 06:15:05.234Z; oldest available reading none.
No retained observations yet. Reload after the existing scheduled source pass runs.
Highest listed forecast: 3.1 ft at 2026-10-19 14:00:00 UTC; issued 2026-10-16 18:30:00 UTC. Action stage.
Impacts and the full forecast are read for gauges in flood; this one is at action stage.
Gauge thresholds: action 2.5 ft; minor 3.5 ft; moderate 4 ft; major 5 ft.
| Observed (UTC) | Stage / units | Source category / water |
|---|---|---|
| No retained observations. | ||
Each report keeps its observation time, first capture of this version, and the SHA-256 of the source bulk body. Corrections at the same observation time replace that point and are marked; unrelated bulk-file changes do not freshen a report.
Only observed gauge records enter this history. Forecast maxima and forecast hydrograph points never become observations. A missing datum or unsupported flow value remains unknown.
Observation source page · Cached readings as JSON · Official source
Source-message history is not recorded imagery replay. Recorded radar/satellite imagery is not available in this view.
Auto-updating checks this site’s cache every minute; each source keeps its own clock.
NOAA’s radar for the area, loaded by your browser as on the Radar page.
Live tiles; the radar keeps no last-good copy.
Nothing has changed since 07:13Z.
The products’ own words and times, and what is no longer in force since the last read. Never written by AI.
An area you chose, not a storm’s footprint: everything here is in force in this area, never “from this storm”.
No warning, watch or advisory for these hazards is in force in this area.
NWS’s alerts checked : a successful check, so this is none in force, not “can’t tell”.
NWS warnings and SPC watches checked
Radar live tiles, no last-good copy
Not an official warning service. Warnings and watches are the National Weather Service’s, outlooks and reports the Storm Prediction Center’s and the Weather Prediction Center’s (Data: NOAA/NWS, NOAA/SPC, NOAA/WPC). When a warning is issued for you, act on it, and use weather.gov or a NOAA Weather Radio for where you are.