

Radar
NOAA’s radar for the area, loaded by your browser as on the Radar page.
Live tiles; the radar keeps no last-good copy.
Storm Mode / Tracked area
8 warnings total · 0 tornado warnings · 8 alerts including watches and advisories
Current alert feed · checked
Places saved on this device appear here with scripting enabled.
NWS’s polygons as issued, or the zones a zone-issued alert names; SPC’s watches by their counties. Checked . Data: NOAA/NWS, NOAA/SPC.
Interactive imagery loads separately. Missing radar does not remove warnings or imply clear weather.
Alert outlines: NOAA/NWS; cell points/observed segments: IEM/NEXRAD. A warning polygon is not a tornado footprint.
Total lightning, including in-cloud activity. Not ground-strike locations or a safe-to-go-outside signal.
Cached lightning observations have not loaded. An empty map is not zero lightning.
Source-rendered snow depth and snow water equivalent for the lower 48. History changes this snow picture only; warnings and radar keep their own clocks.
Stored snow depth · footprint valid 2026-10-17 00:00:00 UTC, picture retrieved 2026-10-17 06:08:57.387 UTC.
No NOHRSC picture displayed on the interactive map.
 0 - 0.39 in
 0.39 - 2.0 in
 2.0 - 3.9 in
 3.9 - 9.8 in
 9.8 - 20 in
 20 - 39 in
 39 - 59 in
 59 - 98 in
 98 - 197 in
 197 - 295 in
 295 - 394 in
 394 - 787 in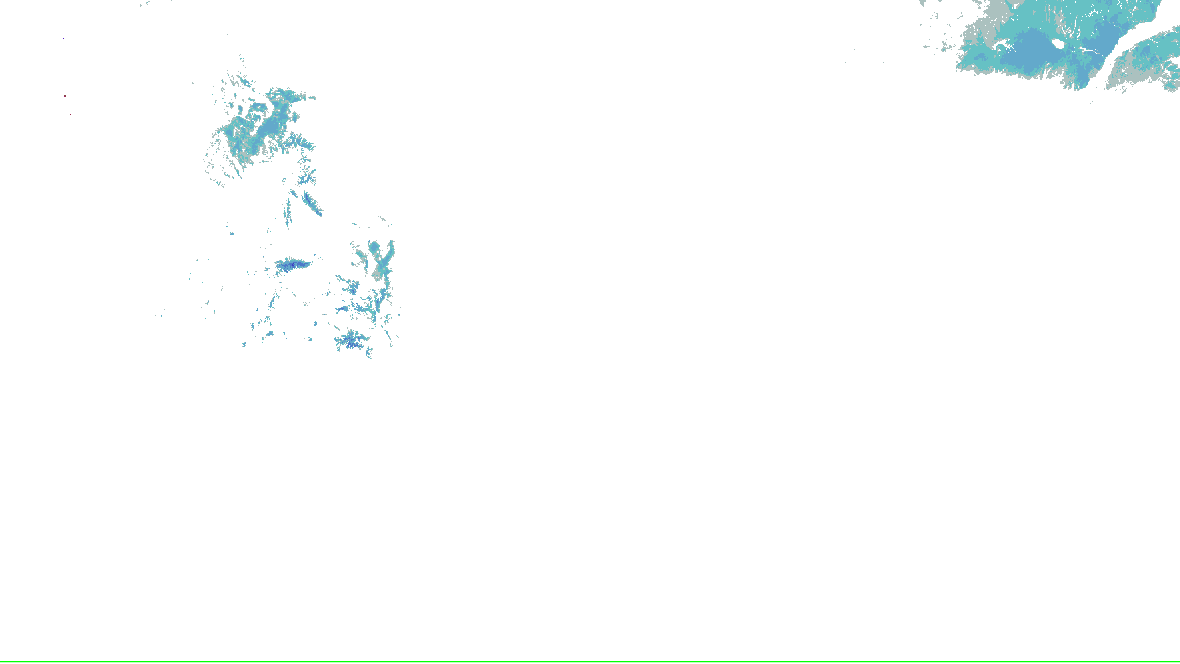
NOHRSC footprint times are metadata; pixel analysis time is not independently verified. Snow-depth pixels have previously differed from the footprint time. This is modeled/assimilated snow analysis, not a measurement at a place. Unshaded and no-data areas do not establish zero snow.
Collector checked not reported; feed generated not reported. Zero cells does not establish coverage or clear weather. Observations from different radars are not merged.
Surface source current; observed water-level source current. Each reading keeps its own time. Map markers show at most 500 stations and 500 gauges; the complete source directory is paginated.
Circle: surface station; square: water-level gauge. Filled: current reading and source; hollow: stale, unconfirmed or missing observation. Marker color is not a hazard category. Enable “Stations and gauges” in Layers to inspect them on the map.
Showing 50 of 50 listed sources. All surface stations and retained trends · All supported gauges and forecasts
current · Observed 2026-10-17 07:15:00 UTC · wind 4 kt · temperature -0.5 °C.
Station KFLY · -104.5684, 38.9439 (longitude, latitude).
Source checked 2026-10-17 07:30:05.704Z · current.
Station observations, not an address forecast or cyclone maximum wind. Maintenance-flagged, old and implausible reports are excluded by the existing parser; this is not independent NWS quality control.
Retained observations: 5; target 24 hours, at most 96 reports per station. Recording began 2026-10-17 06:15:07.108Z; oldest available reading 2026-10-17 05:55:00 UTC.
Observed sea-level pressure: no readable observations.
| Observed (UTC) | Wind / gust (kt) | From (° true) | Temperature / dew point (°C) | Pressure (mb) | Visibility (mi) |
|---|---|---|---|---|---|
| 2026-10-17 05:55:00 UTC | 5 / Not reported | 270 | 0.1 / -6.7 | Not reported | 10 or more |
| 2026-10-17 06:15:00 UTC | 6 / Not reported | 260 | 0 / -6.5 | Not reported | 10 or more |
| 2026-10-17 06:35:00 UTC | 5 / Not reported | 270 | 0 / -6.6 | Not reported | 10 or more |
| 2026-10-17 06:55:00 UTC | 5 / Not reported | 350 | -0.7 / -6.6 | Not reported | 10 or more |
| 2026-10-17 07:15:00 UTC | 4 / Not reported | 310 | -0.5 / -6.5 | Not reported | 10 or more |
Each report keeps its observation time, first capture of this version, and the SHA-256 of the source bulk body. Corrections at the same observation time replace that point and are marked; unrelated bulk-file changes do not freshen a report.
bc11437b0ef17dcf4b91f1dd747598a8f12e615b799dd81a79f1255842a6924c.d2367d9768b90c597493305ffa360f940ef03b7106f33dd081f52a3184a99a76.9c6f5a3106002efdcc7a8b2d0e8218089792e9eef38cd8299c5bd836e5d42087.bb6a8a40e3bed4e1a6d2b0819f1d14e96e53cbfc2f45540efd8023f74290ea00.72518a7cc84febeb6a5215ea486f40da6a7f9fd82c469215c981994a032b8dde.Values use the decoded station report. Null means not reported, never zero. Gust is kept separate from sustained wind.
Observation source page · Cached readings as JSON · Official source
Source-message history is not recorded imagery replay. Recorded radar/satellite imagery is not available in this view.
Auto-updating checks this site’s cache every minute; each source keeps its own clock.
NOAA’s radar for the area, loaded by your browser as on the Radar page.
Live tiles; the radar keeps no last-good copy.
Nothing has changed since 07:30Z.
The products’ own words and times, and what is no longer in force since the last read. Never written by AI.
An area you chose, not a storm’s footprint: everything here is in force in this area, never “from this storm”.
No warning, watch or advisory for these hazards is in force in this area.
NWS’s alerts checked : a successful check, so this is none in force, not “can’t tell”.
NWS warnings and SPC watches checked
NWS watches and advisories checked
Radar live tiles, no last-good copy
Not an official warning service. Warnings and watches are the National Weather Service’s, outlooks and reports the Storm Prediction Center’s and the Weather Prediction Center’s (Data: NOAA/NWS, NOAA/SPC, NOAA/WPC). When a warning is issued for you, act on it, and use weather.gov or a NOAA Weather Radio for where you are.