

Forecast track
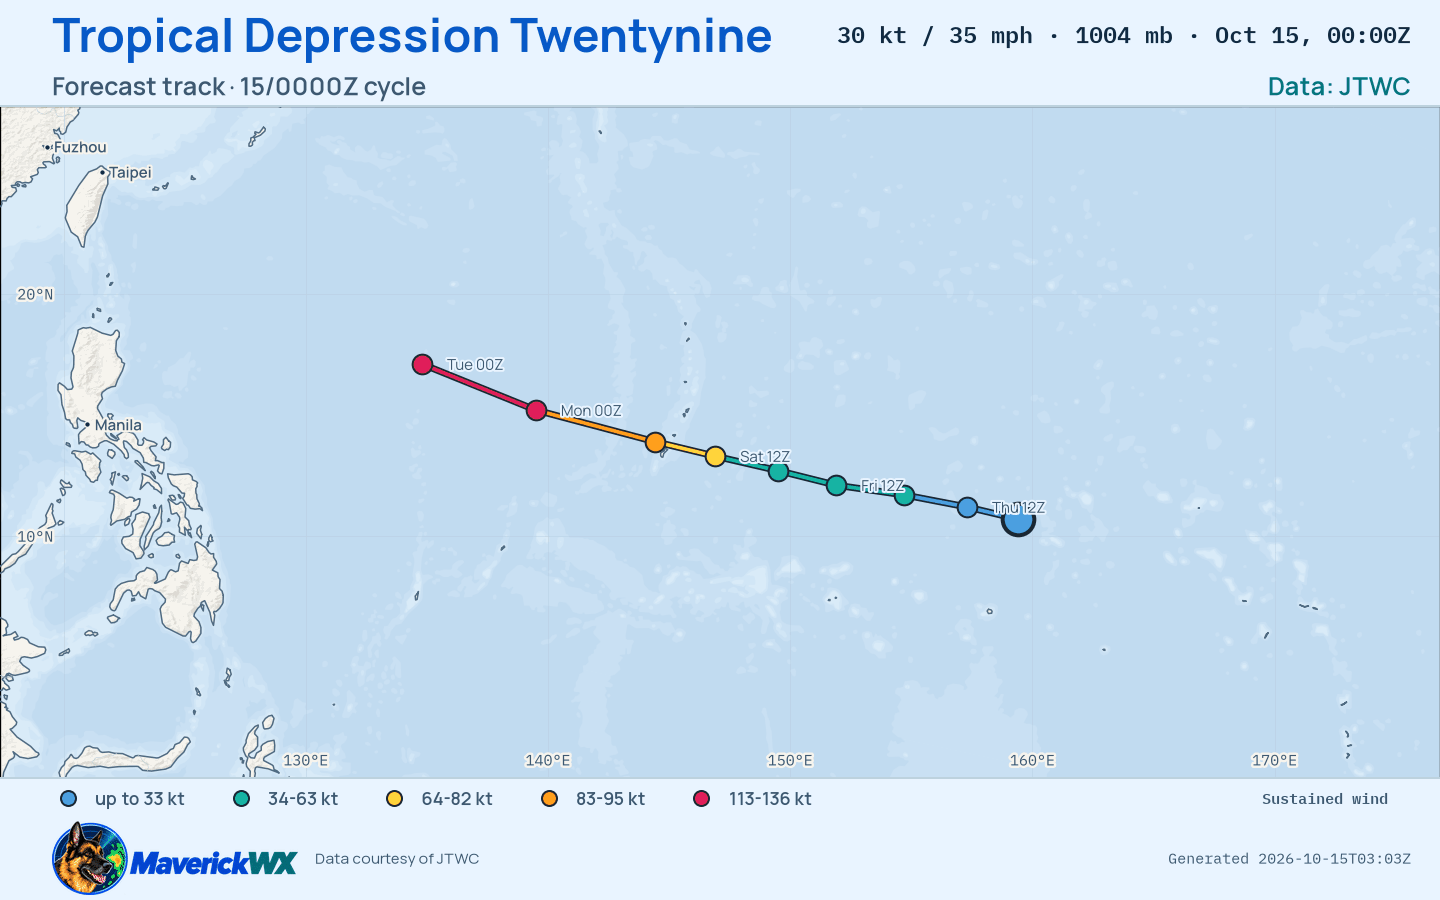
The official forecast track, drawn by this site from JTWC’s Warning 3 (). Not an official JTWC product. Data: JTWC. JTWC’s own.
30 kt · 35 mph · 1004 hPa · WNW at 11 kt
Storm Mode · JTWC Warning 3 ·
Historical advisory selected · current imagery and impacts are not attached
Observed imagery loads separately from the advisory. The base map is not observed satellite imagery.
JTWC supplies no cone for this issuance; none is invented.
Forecast positions are estimates, not observations.
Each entry selects one immutable snapshot. Intermediate, special and corrected records are separate identities where retained. Current NWS context is labelled separately. Historical impact manifests are not retained by this index; newer impacts are never attached to an earlier advisory. Same-time corrections replaced in the publisher’s index cannot be selected unless still listed.
| Official issuance | Revision kind | Record |
|---|---|---|
| JTWC Warning 11 · | advisory | Snapshot 0bf22ebc |
| JTWC Warning 10 · | advisory | Snapshot eea89e7f |
| JTWC Warning 8 · | advisory | Snapshot ff92eaa6 |
| JTWC Warning 7 · | advisory | Snapshot 9d193cf4 |
| JTWC Warning 6 · | advisory | Snapshot 4d09f045 |
| JTWC Warning 5 · | advisory | Snapshot 7447d924 |
| JTWC Warning 4 · | advisory | Snapshot 2d609133 |
| JTWC Warning 3 · | advisory | Snapshot d96ff9c8 · Selected |
| JTWC Warning 2 · | advisory | Snapshot d99cea2d |
| JTWC Warning 1 · | first | Snapshot 99aef0d4 |
Solid: JTWC Warning 3 ·
Dashed: JTWC Warning 2 · . Comparison uses each record’s own geometry. A revision is not a landfall or impact prediction.
| Field | Selected issuance | Comparison issuance | Change |
|---|---|---|---|
| Maximum sustained wind | 30 kt · 35 mph | 30 kt · 35 mph | 0 kt |
| Minimum pressure | 1004 hPa | 1004 hPa | 0 hPa |
| Center position | 10.7°N, 159.4°E | 10.4°N, 160.5°E | Different observation times; not a forecast shift |
Forecast comparison unavailable: these records have no matching forecast valid times. No interpolation or six-hour step is assumed.
U.S. territories JTWC’s forecast track passes within 300 nm of, Warning 3: Guam and Northern Mariana Islands. Current geographical context; these alerts are not attributed to the cyclone and are not part of the historical advisory.
Most urgent first, by the Briefing’s ranking. Checked .
Guam Coastal Waters; Rota Coastal Waters; Guam; Rota
Typhoon Warning issued October 17 at 11:12AM ChST by NWS Tiyan GU
Issued · ends
Official Typhoon Warning bulletinTinian Coastal Waters; Saipan Coastal Waters; Tinian; Saipan
Tropical Storm Warning issued October 17 at 11:12AM ChST by NWS Tiyan GU
Issued · ends
Official Tropical Storm Warning bulletinGuam; Rota; Tinian; Saipan
Coastal Flood Warning issued October 17 at 10:25AM ChST until October 19 at 4:00AM ChST by NWS Tiyan GU
Issued · ends
Official Coastal Flood Warning bulletinGuam; Rota; Tinian; Saipan
High Surf Warning issued October 17 at 10:25AM ChST until October 19 at 4:00AM ChST by NWS Tiyan GU
Issued · ends
Official High Surf Warning bulletinTinian; Saipan
Typhoon Watch issued October 17 at 9:13AM ChST by NWS Tiyan GU
Issued · ends
Official Typhoon Watch bulletinGuam; Rota; Tinian; Saipan
Flood Watch issued October 17 at 5:01AM ChST until October 18 at 4:00PM ChST by NWS Tiyan GU
Issued · ends
Official Flood Watch bulletinJTWC Warning 3 · advisory · forecast cycle . Forecast positions are future estimates, not observed imagery. Classification is shown only where published.
| Valid time / lead | Position | Classification | Sustained wind |
|---|---|---|---|
+12 h from forecast cycle | 11.2°N, 157.3°E | tropical depression | 30 kt · 35 mph |
+24 h from forecast cycle | 11.7°N, 154.7°E | tropical storm | 35 kt · 40 mph |
+36 h from forecast cycle | 12.1°N, 151.9°E | tropical storm | 45 kt · 52 mph |
+48 h from forecast cycle | 12.7°N, 149.5°E | tropical storm | 55 kt · 63 mph |
+60 h from forecast cycle | 13.3°N, 146.9°E | typhoon | 70 kt · 81 mph |
+72 h from forecast cycle | 13.9°N, 144.4°E | typhoon | 85 kt · 98 mph |
+96 h from forecast cycle | 15.2°N, 139.5°E | typhoon | 115 kt · 132 mph |
+120 h from forecast cycle | 17.1°N, 134.8°E | typhoon | 125 kt · 144 mph |
The storm’s area, by its warning centre’s products: everything listed is in force in this area, never “from this storm”.
This map draws the contiguous United States, and Guam and Northern Mariana Islands are beyond it. What is in force there is listed under “In force in this area”.
Nothing has changed since 02:25Z.
The products’ own words and times, and what is no longer in force since the last read. Never written by AI.
The official forecast track, drawn by this site from JTWC’s Warning 3 (). Not an official JTWC product. Data: JTWC. JTWC’s own.
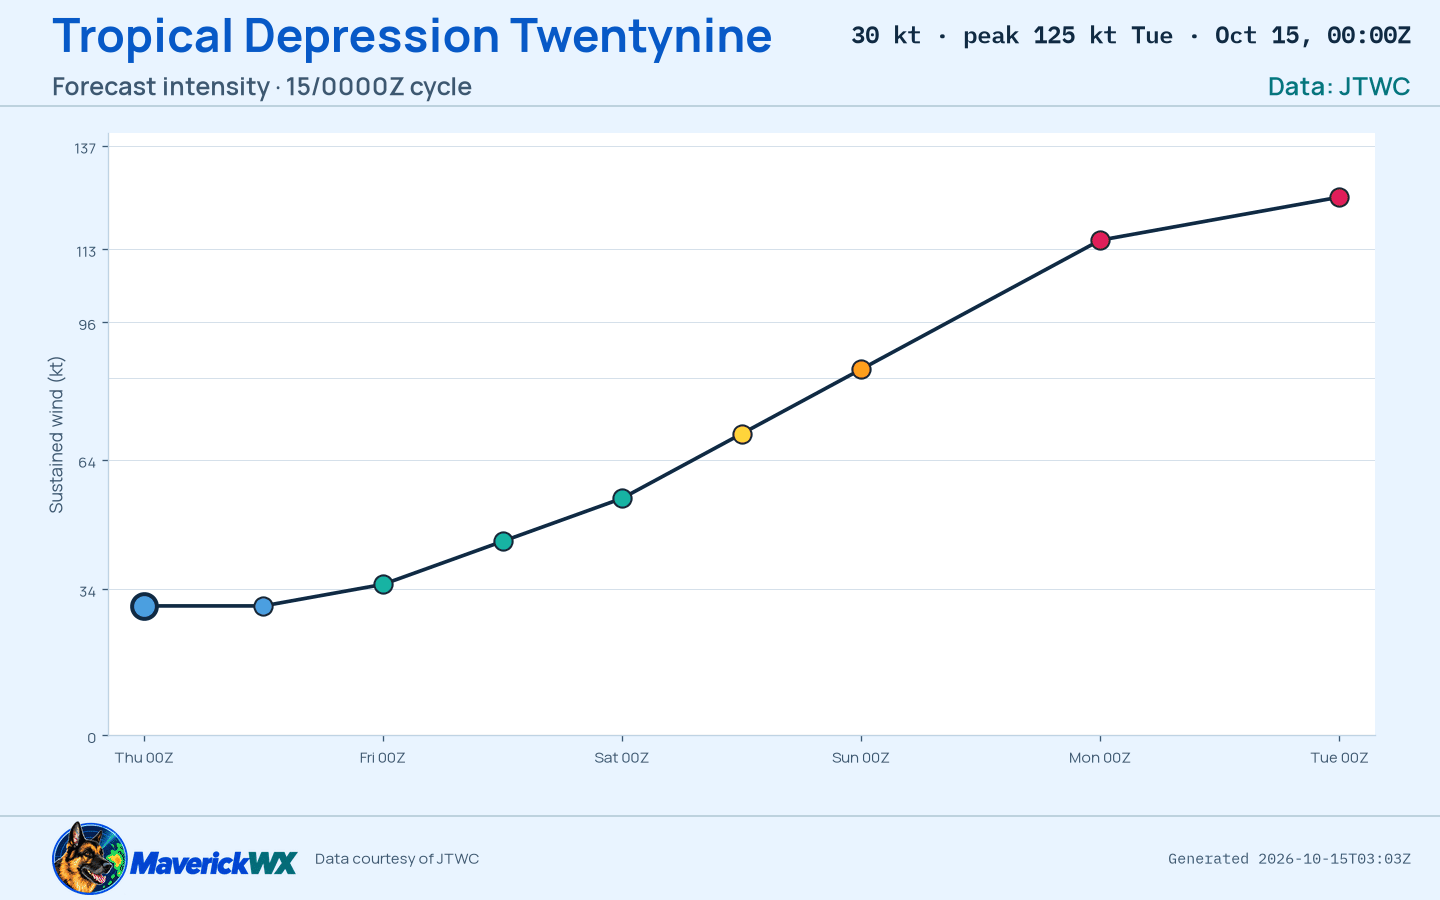
The official intensity forecast, drawn by this site from JTWC’s Warning 3 (). Not an official JTWC product. Data: JTWC. JTWC’s own.
The storm’s page shows it on the satellite, loaded by your browser.
Imagery from NASA GIBS: NOAA GOES and JMA Himawari.
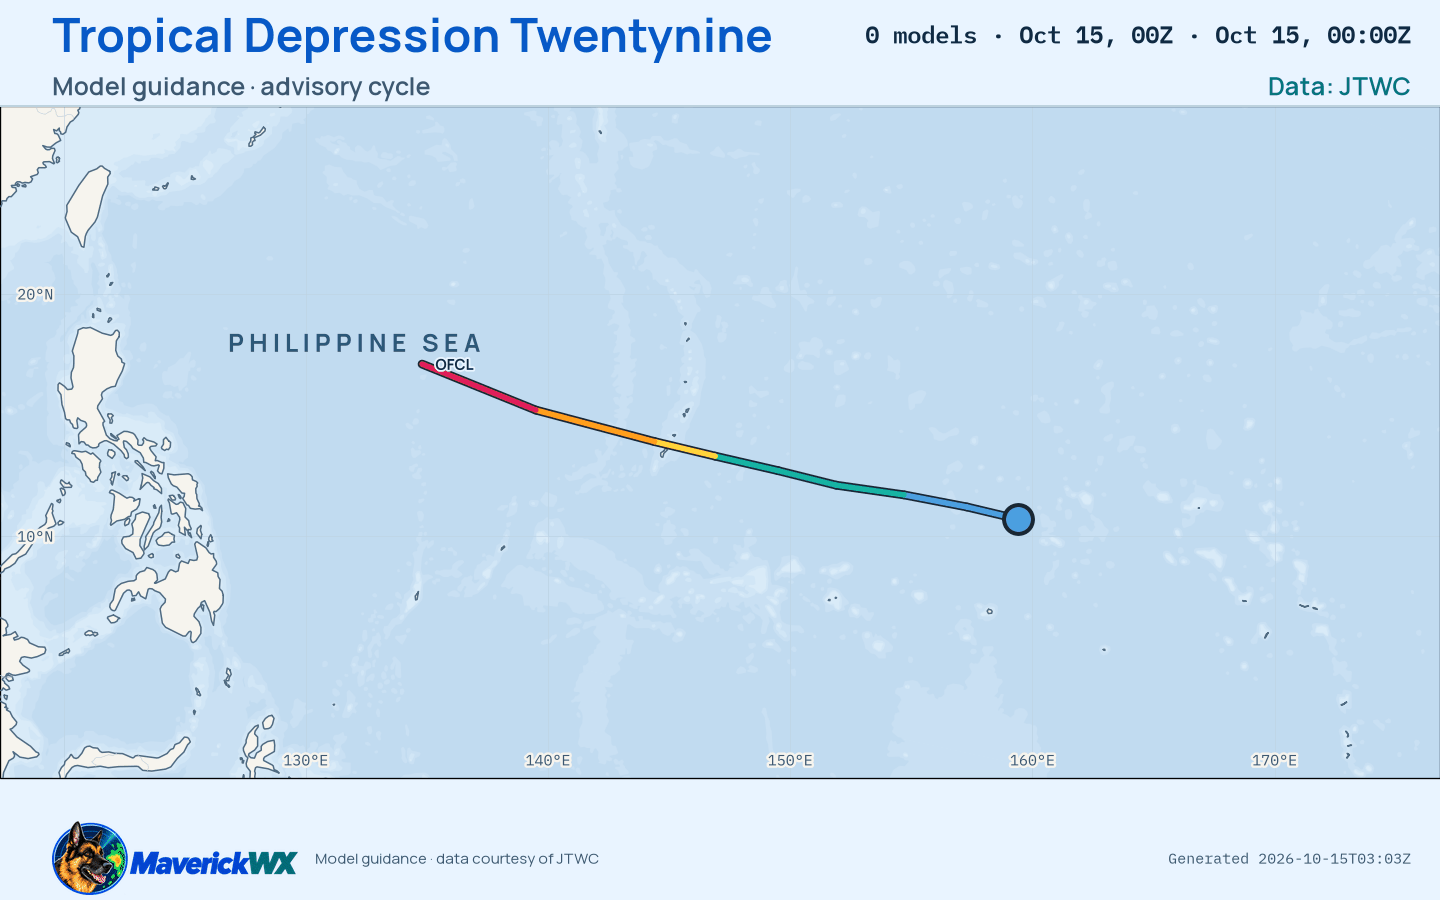
The models’ tracks, which are not a forecast, drawn by this site from JTWC’s Warning 3 (). Not an official JTWC product. Data: JTWC. JTWC’s own.
WPC’s excessive rainfall outlook, to , issued : a chance of flash flooding, in four categories. Data: NOAA/WPC.
No river, coastal or lake gauge in this area is in flood, observed or forecast.
NWS’s gauges at flood stage or above in the area, worst first, each with its forecast hydrograph on Rain & rivers. Data: NOAA/NWPS.
WPC’s rain forecast and MRMS’s radar estimate of the rain that fell, on the Briefing’s map for the area.
Data: NOAA/WPC, NOAA/NSSL MRMS.
SPC’s Day 1 categorical outlook, valid to , issued . SPC’s categories, as drawn. Data: NOAA/SPC.
No tornado or severe thunderstorm watch in force in this area.
SPC’s watches, by number, matched by the counties they list. Data: NOAA/SPC.
No mesoscale discussion reaches this area.
SPC’s mesoscale discussions whose outline reaches the area. Data: NOAA/SPC.
SPC’s hourly mesoanalysis, observed soundings and model guidance for the area, on the Analysis tab with its own clocks.
Drawn by the Analysis tab’s own renderer. Data: NOAA/SPC, NOAA/NCEP.
NOAA’s radar for the area, loaded by your browser as on the Radar page.
Live tiles; the radar keeps no last-good copy.
JTWC warning, as published checked
NWS warnings and SPC watches checked
NWS watches and advisories checked
SPC mesoscale discussions checked
SPC Day 1 outlook checked
WPC excessive rainfall checked
NWPS river gauges checked
Radar live tiles, no last-good copy
Not an official warning service. Warnings and watches are the National Weather Service’s, outlooks and reports the Storm Prediction Center’s and the Weather Prediction Center’s (Data: NOAA/NWS, NOAA/SPC, NOAA/WPC). When a warning is issued for you, act on it, and use weather.gov or a NOAA Weather Radio for where you are.