

Forecast track

The official forecast track, drawn by this site from JTWC’s Warning 30 (). Not an official JTWC product. Data: JTWC. JTWC’s own.
Current advisory context · 30 kt · 35 mph · NE at 7 kt
Storm Mode · JTWC Warning 30 ·
Final advisory · monitoring can continue
Observed imagery loads separately from the advisory. The base map is not observed satellite imagery.
JTWC supplies no cone for this issuance; none is invented.
Replay uses retained source bytes. Recording begins with activation; missing history is not clear weather.
Live sources keep independent clocks.
Rolling target: 24 hours; cells: six hours. Radar: NOAA MRMS national overview, 8-minute tolerance. Satellite: original GOES GeoColor day/night picture, hourly sampling, 75-minute tolerance. No interpolation or latest-image fallback. Warning and source checks retain their own clocks. “Recorded by” is collector acquisition evidence, not exact browser publication history.
Current GLM density, velocity and specialist layers are hidden during replay. Snow uses retained footprint metadata with unverified pixel time. Forecast uses one pinned issuance/run and exact valid time.
No observed replay frame displayed.
Open the complete replay reader (works without scripting or WebGL)Use Forecast above to pin an official issuance and valid point. The forecast table and advisory history remain available below.
Current cached context, independently dated. Regional products keep their published footprint; they are not clipped or attributed to one storm. This section remains separate from the historical replay cursor and official cyclone forecast. Use Forecast to pin a retained model package.
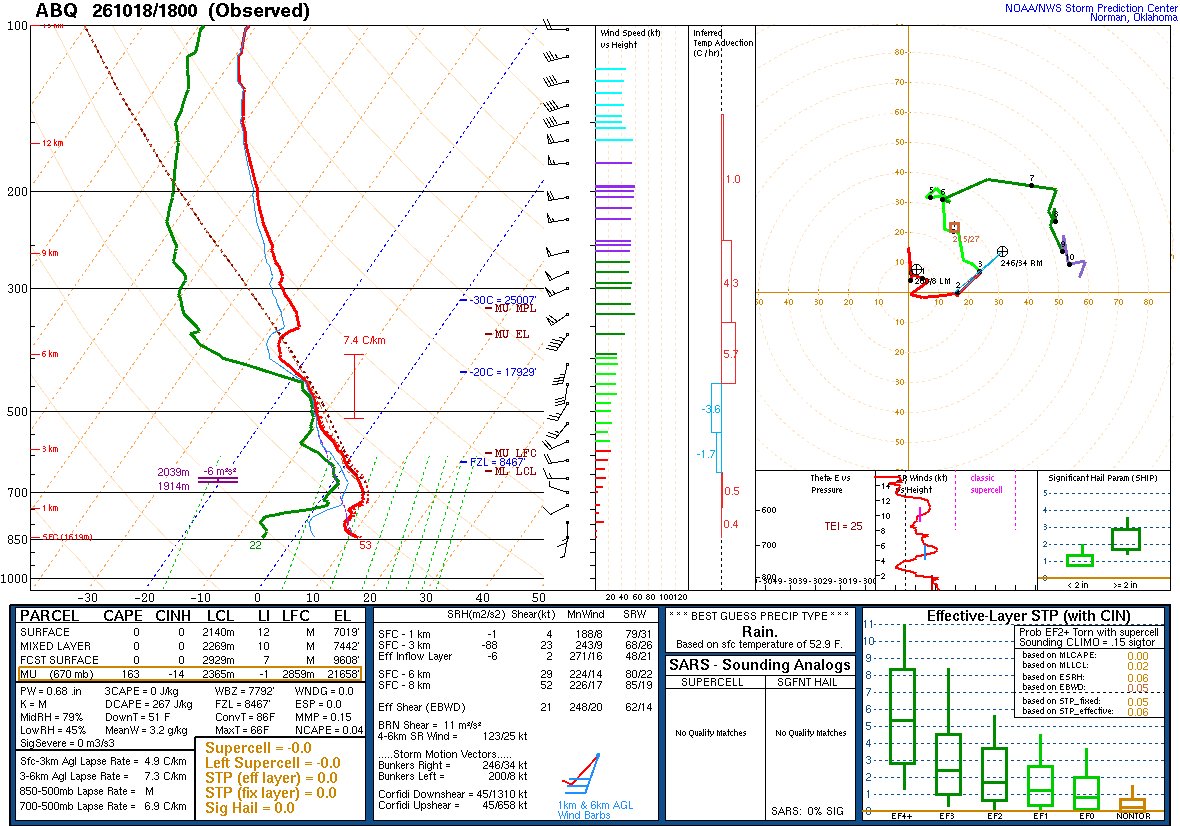
A balloon launched about an hour before the time named, measuring as it rose and drifted with the wind: the atmosphere above one place, at one time. Model soundings, which are forecasts, are not shown here.
| Pressure | Height | Temperature | Dew point | Wind |
|---|---|---|---|---|
| 845 mb | 1619 m | 11.6 | -5.4 | 190° 4 kt |
| 833 mb | 1738 m | 9.8 | -5.2 | — |
| 819 mb | 1879 m | 8.4 | -5.6 | — |
| 794 mb | 2134 m | 7.3 | -7.6 | 180° 15 kt |
| 779 mb | 2292 m | 7.4 | -7.6 | — |
| 766 mb | 2430 m | 7.6 | -5.4 | — |
| 752 mb | 2582 m | 6.4 | -0.6 | — |
| 740 mb | 2714 m | 7.0 | 2.2 | — |
| 727 mb | 2861 m | 7.8 | 1.8 | — |
| 711 mb | 3048 m | 7.3 | 0.8 | 310° 1 kt |
| 700 mb | 3173 m | 6.8 | 0.8 | 290° 5 kt |
| 685 mb | 3353 m | 5.9 | 1.1 | 275° 12 kt |
| 670 mb | 3533 m | 5.0 | 1.4 | — |
| 660 mb | 3658 m | 4.2 | 0.2 | 270° 17 kt |
| 636 mb | 3962 m | 1.7 | -1.2 | 275° 16 kt |
| 612 mb | 4267 m | -0.4 | -3.7 | 260° 21 kt |
| 601 mb | 4411 m | -1.3 | -5.3 | — |
| 591 mb | 4545 m | -2.5 | -6.3 | — |
| 571 mb | 4817 m | -4.3 | -10.3 | — |
| 545 mb | 5182 m | -7.5 | -10.1 | 240° 21 kt |
| 532 mb | 5371 m | -8.9 | -10.6 | — |
| 513 mb | 5652 m | -10.3 | -11.3 | — |
| 500 mb | 5850 m | -11.7 | -12.4 | 210° 24 kt |
| 486 mb | 6067 m | -12.5 | -13.3 | — |
| 471 mb | 6305 m | -13.7 | -14.3 | — |
| 455 mb | 6566 m | -15.5 | -16.6 | — |
| 443 mb | 6767 m | -16.7 | -17.6 | — |
| 429 mb | 7010 m | -19.2 | -23.1 | 190° 32 kt |
| 411 mb | 7315 m | -22.4 | -29.9 | 195° 36 kt |
| 400 mb | 7520 m | -24.5 | -34.5 | 205° 33 kt |
| 378 mb | 7930 m | -26.5 | -40.5 | — |
| 368 mb | 8124 m | -26.9 | -41.9 | — |
| 358 mb | 8323 m | -26.1 | -42.1 | — |
| 333 mb | 8839 m | -27.0 | -46.8 | 235° 60 kt |
| 319 mb | 9144 m | -29.2 | -48.7 | 240° 54 kt |
| 308 mb | 9404 m | -31.3 | -50.3 | — |
| 300 mb | 9590 m | -32.7 | -50.7 | 245° 54 kt |
| 290 mb | 9829 m | -33.9 | -50.9 | — |
| 272 mb | 10278 m | -36.3 | -54.3 | — |
| 257 mb | 10668 m | -39.1 | -56.2 | 255° 53 kt |
| 250 mb | 10860 m | -39.9 | -56.9 | 250° 55 kt |
| 227 mb | 11512 m | -44.5 | -61.5 | — |
| 215 mb | 11887 m | -46.6 | -62.6 | 260° 57 kt |
| 203 mb | 12252 m | -48.7 | -63.7 | — |
| 200 mb | 12350 m | -49.1 | -64.1 | 260° 59 kt |
| 178 mb | 13106 m | -53.8 | -67.1 | 265° 57 kt |
| 163 mb | 13661 m | -57.3 | -69.3 | — |
| 150 mb | 14180 m | -60.3 | -72.3 | 255° 42 kt |
| 140 mb | 14630 m | -62.4 | -73.1 | 250° 44 kt |
| 127 mb | 15208 m | -65.9 | -74.9 | — |
| 114 mb | 15850 m | -69.3 | -78.3 | 255° 38 kt |
| 102 mb | 16523 m | -71.3 | -79.3 | 270° 18 kt |
| 100 mb | 16640 m | -71.1 | -79.1 | 260° 26 kt |
SPC observed soundings checked · Data: NOAA/SPC
None: JTWC’s forecast track passes within 300 nm of no U.S. territory with NWS zones, Warning 30. Current geographical context; these alerts are not attributed to the cyclone.
No U.S. territory is in this storm’s area: JTWC’s track passes within 300 nm of none. Its own panels are shown, and no NWS alert is listed.
JTWC Warning 30 · advisory · forecast cycle . Forecast positions are future estimates, not observed imagery. Classification is shown only where published.
| Valid time / lead | Position | Classification | Sustained wind |
|---|---|---|---|
+12 h from forecast cycle | 33.7°N, 141.1°E | tropical depression | 30 kt · 35 mph |
+24 h from forecast cycle | 36.5°N, 145.2°E | tropical depression | 30 kt · 35 mph |
Each entry selects one immutable snapshot. Intermediate, special and corrected records are separate identities where retained. Current NWS context is labelled separately. Historical impact manifests are not retained by this index; newer impacts are never attached to an earlier advisory. Same-time corrections replaced in the publisher’s index cannot be selected unless still listed.
| Official issuance | Revision kind | Record |
|---|---|---|
| JTWC Warning 30 · | advisory | Snapshot fe417aba · Selected |
| JTWC Warning 29 · | advisory | Snapshot c42914ce |
| JTWC Warning 28 · | advisory | Snapshot 9ee9be54 |
The storm’s area, by its warning centre’s products: everything listed is in force in this area, never “from this storm”.
The official forecast track, drawn by this site from JTWC’s Warning 30 (). Not an official JTWC product. Data: JTWC. JTWC’s own.

The official intensity forecast, drawn by this site from JTWC’s Warning 30 (). Not an official JTWC product. Data: JTWC. JTWC’s own.
The storm’s page shows it on NASA GIBS (NOAA GOES, JMA Himawari)’s imagery, loaded by your browser. Himawari at 2° from the storm's meridian.
Imagery from NASA GIBS: NOAA GOES and JMA Himawari.

The models’ tracks, which are not a forecast, drawn by this site from JTWC’s Warning 30 (). Not an official JTWC product. Data: JTWC. JTWC’s own.
NOAA’s radar for the area, loaded by your browser as on the Radar page.
Live tiles; the radar keeps no last-good copy.
JTWC warning, as published checked
Radar live tiles, no last-good copy
Not an official warning service. Warnings and watches are the National Weather Service’s, outlooks and reports the Storm Prediction Center’s and the Weather Prediction Center’s (Data: NOAA/NWS, NOAA/SPC, NOAA/WPC). When a warning is issued for you, act on it, and use weather.gov or a NOAA Weather Radio for where you are.